Navigation and Dashboard
The dashboard is your starting point after signing in. It provides a summary of your environment and shortcuts to key workflows.
Portal layout
The interactive view below follows the same structure as Varco Manager:
- A top bar for context (including quick access to documentation and profile in the live app).
- A left sidebar for major areas—Overview, infrastructure, reports, access, and more, depending on your role.
- A main workspace for KPIs, tables, maps, and other content.
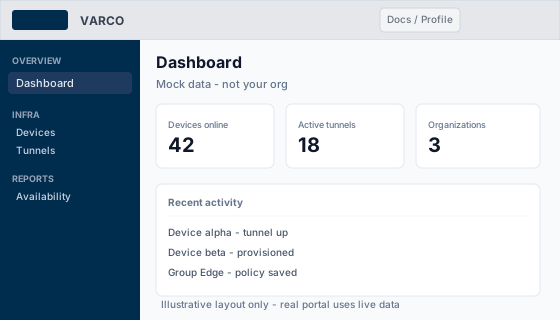
What appears in each area depends on your organization, roles, and feature flags.
Main navigation areas
- Overview: dashboard and high-level metrics
- Infrastructure: devices, tunnels, and provisioning keys
- Tools: actions, file manager, AI chat (if enabled), and log explorer
- Access: users, roles, and organization management (depending on your permissions)
- Account: profile and personal settings
Dashboard highlights
- Device and tunnel totals
- Recent activity timeline
- Quick refresh controls
- Organization-scoped data based on your role
Working efficiently
- Start with the dashboard to check overall status
- Jump directly to the section you need from the side menu
- Use table search and filters in each page to narrow large datasets
Language preferences
You can change your preferred language in your profile settings. The portal UI and this documentation center support English and Brazilian Portuguese.